 2018, Vol. 34
中国科学院微生物研究所、中国微生物学会主办
文章信息
- 罗放, 俞易, 陈铭哲, 杨以清, 魏垠
- Luo Fang, Yu Yi, Chen Mingzhe, Yang Yiqing, Wei Yin
- 外源基因表达造成的群体感应细菌生存压力的建模分析
- Model for fitness burden imposed by exogenous gene expression in quorum sensing bacteria
- 生物工程学报, 2018, 34(12): 1895-1905
- Chinese Journal of Biotechnology, 2018, 34(12): 1895-1905
- 10.13345/j.cjb.180293
-
文章历史
- Received: July 13, 2018
- Accepted: November 29, 2018


引用本文

|


Quorum sensing system makes it possible for bacteria to switch between their genetic expression repertoires under low cell density (LCD) or high cell density (HCD) situations and adjust their behavior according to the size of population. Many biological processes, including virulence[1], biofilm formation[2-4], bioluminescence[5-6] and sporulation[7-8] are closely related to quorum sensing[9] (Fig. 1).

|
| 图 1 在N-AHL诱导下的基因表达和细菌种群动态变化示意图 Figure 1 Gene expression and population dynamics under N-AHL induction. (A) Illustration of the genetical circuit used in the experiment and modeling. (B) The suggested model of bacterial behavior: Bacteria can switch between states of producing exogenous protein but not proliferate or proliferate as normal. (C) High concentration N-AHLs could interrupt bacterial growth independent of the cost of signaling molecule synthesis. |
| |
In the well-studied Lux-type quorum sensing system of Gram-negative bacteria, cells use LuxI-like synthase to produce N-Acyl homoserine lactone (N-AHL) signaling molecules. N-AHLs are 4 to 18 carbon lipophilic molecules and able to pass through the cellular membrane. N-AHLs from different species vary in the C3-carbonyl and the length of acyl chain[2]. The receptor of N-AHL is LuxR-type signaling molecule receptor, a transcription factor that could active gene expression downstream its cognate pLux-type promoter (Fig. 1A).
The well understood mechanisms of Lux-type quorum sensing systems enable researches about expression activation induced by N-AHL signaling molecules by mathematical modeling [10-13]. These models had greatly helped the understanding of Lux-type quorum sensing system and further synthetic system design.
In this study, we measured the gene expression level regulated by LuxR-type signaling molecule receptor and bacterial population growth after the induction by N-AHL signaling molecules.
It is noticed that with a rising concentration of N-AHL signaling molecules, both the carrying capacity and growth rate of bacteria is decreased. Though many models were suggested for how Lux-type receptor-controlled gene expression is regulated in response to N-AHL signal concentration, and the decrease of carrying capacity and growth rate is also been reported[14]. However, most of these works explained such observation by the cost of synthesizing signaling molecule[14], or toxicity of quorum sensing elements[15].
To better explain this phenomenon, we set up a mathematical model considering input signaling molecule concentration and distribution to simulate the induced gene expression process. We further offered a hypothetical model for gene expressing and population dynamics under such circumstance and could partially explain the fitness burden independent of synthesis cost of signal molecule.
1 Materials and methods 1.1 Strains, reagents and cell cultivationEscherichia coli DH5α [F-Φ80lacZΔM15, Δ(lacZYA-argF) U169 recA1 endA1 hsdR17(rk-, mk-) phoA supE44 thi-1 gyrA96 relA1 λ−] (CWbio) was used in this work. E. coli cultures were grown at 37 ℃ in Lysogeny Broth (LB) (25 μg/mL Chloramphenicol, CWbio; 25 g/L LB Broth Miller, Sangon Biotech) for plasmid amplification and in M9 Broth (M9) (25 μg/mL Chloramphenicol, CWbio; 11.3 g/L M9 Broth Miller, Sangon Biotech; 4.00 g/L Glucose, SinoPharm; 0.492 g/L MgSO4·7H2O, SinoPharm; 0.022 g/L CaCl2·6H2O, SinoPharm) for expression experiments; LB selection plates (25 μg/mL Chloramphenicol, CWbio; 40 g/L LB Broth Agar Miller, Sangon Biotech) were used for E. coli transformation. All restriction enzymes were obtained from TaKaRa Biomed (TaKaRa). PCR reactions were carried out using PrimeSTAR® MAX Hi-speed Hi-Fi DNA Polymerase (TaKaRa), and primer oligonucleotides were ordered from TsingKe Biological Technology (TsingKe, Shanghai). All the N-AHLs signaling molecules were purchased from Sigma Aldrich (Sigma).
1.2 Gene circuit designIn our gene circuit, expression of Lux-type signaling molecule receptor (LasR) is regulated by the constitutive promoter BBaJ23100 and expression of GFP is regulated by a cognate pLas promoter. All gene expression is driven by RBS (BBaB0034) [12] and double terminator (BBa_B0015), All genetic circuits were constructed to pSB1C3, a chloramphenicol-resistant high copy number plasmid following BioBrick RFC[10] standard (Fig. 2).

|
| 图 2 表达元件设计 Figure 2 Design of expression vector. Constitutive promoter (BBa_J23100) is placed upstream of the strong RBS (BBaB0034), the signaling molecule receptor ORF and a double terminator (BBa_B0015). A cognate pLux-type promoter regulated fluorescent protein gene is followed. |
| |
The sequence of all the expression vectors are available at parts.igem.org (BBa_K2315011, BBa_K2315030, BBa_K2315024, BBa_K2315014, BBa_K2315020) (Fig.2).
1.3 TransformationE. coli DH5α chemical competent cell (CWbio CW0808S) was used. For each transformation, 100 ng of the plasmid was transformed into 50 μL of competent cells, held on ice for 30 min, heat shock at 42 ℃ for 45 s, 1 mL of LB added following a 30 min incubation, and 200 μL bacteria culture was spread onto selection plate. Our DH5α cells had displayed a typical transformation efficiency of around 1×10⁸ CFU/μL pUC19.
1.4 Fluorescence measurementBacteria cultures was diluted to an optical density of OD600=0.5 and distributed to a 96-well plate in an amount of 200 μL per well. The pre-generated N-AHLs gradient working solution (1 μL, in DMSO) was then added with a multichannel pipette to reduce the duration of the process. N-AHLs signaling molecule concentration gradients was prepared in a DMSO solution by serial dilution. The working solution needed for all experiments was prepared simultaneously to ensure the repeatability. After the N-AHLs was added, the 96-well plate was transferred to a microplate reader (SpectraMax i3x, Molecular Devices and Synergy H1, BioTek) for fluorescence measurement with the parameters below: Mode: kinetic; read1: fluorescence, Ex: 485/20, Em: 528/20; read2: absorbance, Wavelength: 600 nm. A 5s linear shaking was applied before every read.
2 Results 2.1 Basics of modelingWith a constitutively expressed LuxR-type signaling molecule receptor and GFP gene controlled by its cognate promoter, we are able to qualitatively measure the induction efficiency of Lux-type expression vectors (see section 2.2 for details) by measuring the fluorescent readout corresponding to the expression level of GFP and trace the population density simultaneously by recording the optical density of the bacterial culture(Fig.3). For a better understanding of mechanisms and observed phenomenon, a model has been established based on the observed expression response and population change. The symbols used in this work are listed below in Table 1.

|
| 图 3 细菌对信号分子的响应曲线 Figure 3 Bacterial responses for the signaling molecules. (A) Time trace from expression of pCon-LasR-pLas-GFP across a range of 3OC12 N-AHL concentrations (B) Response curve of final gene expression level of corresponding to 3OC12 N-AHL signal molecule concentration. The response curve was fitted using a sigmoidal function and a half response R1/2=1.9×10–10mol/L. |
| |
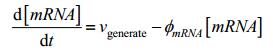
We use a general equation to describe how one substance is generated and existed in a bio-system:

|
Here, X refers to amount of substance, g refers to generating frequency(/s). materials refers to amount of substance of raw material using to generate target substance(/mol). φ refers to decay frequency(/s). When it comes to protein synthesis, this process is always described as follows according to general equation:
|
(1) |

|
| Symbol | Meaning |
| [X] | Concentration of X |
| vgenerate | Rates of generation |
| k | Dissociation constant |
| G, H, Ci | Constant |
| n | Hill coefficient |
| N, N(n) | Population (at timepoint n) |
| P(A→B) | Probability of transformation from state A to state B |
| τ | Time delay of toxicity |
| r | Growth rate |
| Vmax | Maximum generate rate |
| φX | Degradation or mortality of X |
| Kmax | Resource load |
| c | Diffusion rate |
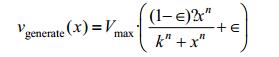
Where vgenerate refers to the efficiency of mRNA transcription and φ refers to the degradation rate of mRNA and protein. vgenerate depends on its intrinsic efficiency and other factors. If the promoter is a constitutive promoter, vgenerate is a constant, and if the promoter is a pLux-type promoter used in our experiment, concentration of the signaling molecule becomes one of the key factors effecting promoter efficiency. Here, the efficiency is given by:
|
Where k refers to the dissociation constant of signaling molecule and LuxR-type transcription factor, x refers to the concentration of signaling molecule, n refers to the order of the binding reactions and ∈ refers to the leakage of promoter.
To build a more precise model for gene expression, we introduced three factors involved in the basic physiological process to our refined model: growth of bacteria, diffusion of signal molecule at initial time and degradation of signal molecule.
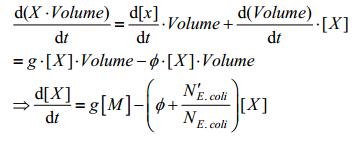
2.1.2 Growth of bacteriaWe first consider about the growth of Escherichia coli, which can not only fluctuate both reactant and product concentration, but also act as an important variable in calculating the final concentration of products. Considering that the model is based on two fundamental relation below. The total amount of substance, the concentration of substance and volume of the chamber where contains the substance are denoted as Total, Concentration, and Volume in the equation, respectively:

|
Put These relations back to equation (1), we have:
|

|
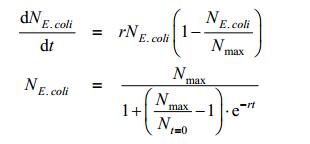
NE.coli is satisfied to following equation:
|
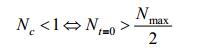
An r refers to growth rate of E. coli and Nmax refers to the limits of E. coli population. Since Nmax and Nt=0 are constants, so we define the following parameter:

|
And 

|
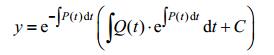
We are familiar with Linear Differential Equation of the First Order and its solution. If we have:

|
The solution should be:
|
We combine this solution with our equation, and then we get
|
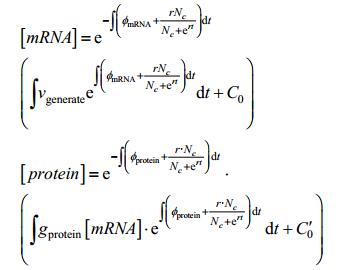
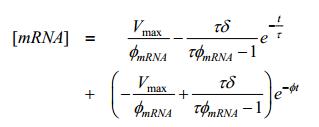
Use lemma 1, 2 that will be explained in the supplementary materials to simplify the solution of mRNA concentration and protein concentration. Then:

|
In which:

|
Apply lemma 2 we have:

|
(2-1) |
We suppose the initial concentration difference between inside and outside of E. coli is C, so we will know that the time for E. coli to balance this difference is:
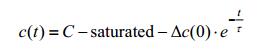
|
Approximately we have:
|
We can rewrite the equation into a simplified form as below:

|
Finally we have:
|
And the concentration of target protein is:
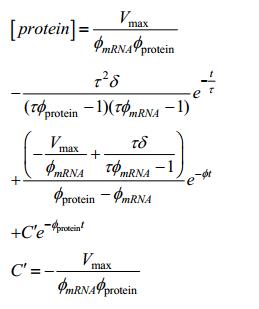
|

|
In the basic model, we neglected the degradation of signaling molecules. However, the degradation is a factor should be taken into consideration in our refined model:
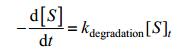
|
So the degradation of signaling molecules can be shown as the following equation:

|
We used a linear form of decay function because the exponential fitting of degradation is so slow that it can be treated as a first-order expansion of an exponential function.
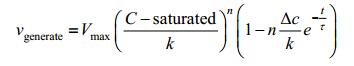
And vgenerate tends to be:

|
Combining the result above with the basic model, finally we have:
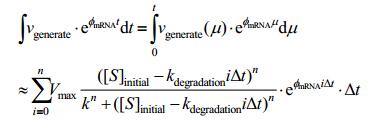
|
In which, nΔt=t
Combining these refinements, the improved mathematical model could better simulate the process of gene expression. Fig. 4 shows the gene expression pattern with the parameters followed: degradation rate=0.0388 mol/s, diffusion parameter=0.958 s, concentration of signaling molecule=0.538 mol/L.

|
| 图 4 对基因表达的模拟结果 Figure 4 Simulation of gene expression pattern. Red curve shows the expression pattern simulated with parameters followed: degradation rate=0.038 8 mol/L·s, diffusion parameter=0.958 s, concentration of signaling molecule= 0.538 mol/L using our refined model. |
| |
We have noticed that with the rise of concentration of N-AHL signaling molecules (N-AHLs), the carrying capacity for the bacterial population is correspondingly decreased. Groups with higher N-AHL concentration grows slower compared to those who are treated with lower N-AHL concentration (Fig.5). In this part, we will discuss an interesting model on how the signal molecule affect the growth and population.

|
| 图 5 pCon-RpaR-pRpa-GFP细菌种群在不同浓度N-AHL诱导下的生长情况 Figure 5 Time trace from population growth of pCon-RpaR-pRpa-GFP across a range of coumaroyl N-AHL concentrations. Inducing starts at OD600≈0.4 600≈0.4 for all groups. After N-AHL stimulation, difference in population growth can be observed between different groups. Groups with higher N-AHL concentration grows slower compared to those who are treated with lower N-AHL concentration. |
| |
Two hypotheses could be proposed to explain the phenomenon that higher N-AHL concentration treated bacteria grows slower:
1. The signal molecule is toxic to E. coli, so the population will decrease related to the increase of concentration linearly.
2. The signal molecule induces the synthesis of GFP which occupy the substance that is originally used for growth. If the GFP is produced, the population will be at a low level, otherwise the population will be at normal level.
2.2.1 AssumptionsWe analyzed the experiments result and give a comprehensive model which combines these two hypothesis based on the following assumptions:
1. E. coli cells under the induction of signaling molecules are either in the state: A, proliferate or B, producing exogenous protein but not proliferate.
2. The influence of toxicity will be acted on the bacteria with a time delay.
2.2.2 ModelE. coli could transform between two states by the probability equals to:

|
The refined model of population size at timepoint n based on these assumptions (Fig. 6) will be:
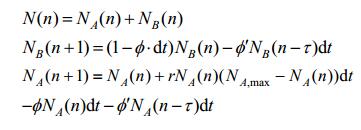
|

|
| 图 6 细菌种群生长曲线的预测结果 Figure 6 Predicted growth curve of bacterial population. Parameters used in the simulation: initial population of condition A=0.1 OD; Initial population of condition B=0.1 OD; P0=0.3; Pt=1; Nmax=0.9 OD; φ=0.03 OD/s; dt=0.1 s; Growth rate=0.3 OD/s; φ'=0.1 OD/s. |
| |
Our experiment result shows that even without the existence of signaling molecule synthase, the bacterial population still suffers from decreased growth rate and carrying capacity. This result suggests that the synthesis cost alone cannot completely explain the observed fitness burden phenomenon and there should be some vector other than the cost of synthesizing signaling molecules which could affect the population dynamics of the exogenous gene expressing quorum sensing bacteria.
As is shown in Fig. 5 and Fig. 6, this refined population model well reproduces the shape of growth curves observed in the experiment. It shows a possible way to explain the unknown factor behind the fitness burden in the non-signal molecule producing bacterial population.
4 DiscussionAs we concluded in the previous section, signaling molecule synthesis cannot alone explain the fitness burden in the quorum sensing systems. However, due to the difficulty to synchronize the population size and bacterial status between different bacterial cultures for simultaneous measurement, the model we developed could not convincingly rule out the role of the toxicity of N-AHL. Therefore, further study might be able to target the major factor of fitness burden through solving or bypassing this paradox.
In the logistic model of microbial population, the birth rate is usually considered as a constant which shows the proliferation ability of individuals in species. In the classical model, the main factor responsible for growth rate changing is the competition between the population and carrying capacity which is a measure of the available resources. Therefore, to simplify the calculation burden, generally, we take birth rate as a constant in limited generations. It is indeed a strong assumption for the model and is required additional experiments to measure the actual proliferation rate for every individual in the population as well as the cell division limits.
In a previous study about calibration of microbial growth measurement, Stevenson et al. suggested that the OD obtained is proportional to the cell number until starvation when cell size is no longer constant[13]. In our experiment results, we have not observed any phenomenon indicating such change in cell size (i.e. sudden change points in OD time trace curve). Also, the maximum OD we observed has an equivalent of 0.4 in 1 cm optical path length, so we assume that the OD value we observed could properly indicate the cell number in the culture.
5 Supplementary materials 5.1 Two lemmasHere we give two lemmas to simplify calculation.
Lemma 1:
|
Proof:

|
Also we have:

|
Lemma 2:
If 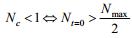

|
Proof:
According to lemma1, we have:
|
Do some transformation on Nc(t), which helps us solve this problem partly according to this fact:

|
So we suppose:
|
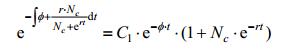
From the biological perspective, this indicates the initial population of E. coli has been more than the half of maximum population, this assumption roughly fits our experiments. This condition promises following equation:
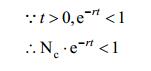
|
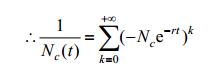
|
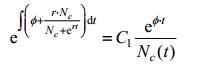
So we will have:

|
Apply to the solution of [mRNA]:
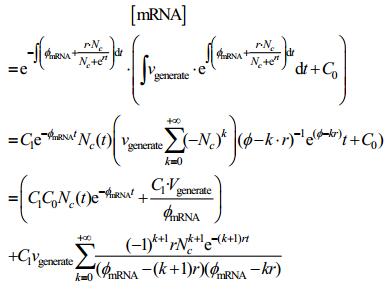
|
We thank the ShanghaiTech University Undergraduate Lab Training Facility, Molecular & Cell Biology Core Facility, Wei L. Shen Lab, Min Zhuang Lab, Chao Zhong Lab and Zhi Li Lab for their equipments and reagents. We would also thank other 2017 ShanghaiTech iGEM team members for their supporting works.
团队简介:
我们是来自于上海科技大学的iGEM队伍ShanghaiTech, 此次比赛是上海科技大学所参加的第二届iGEM比赛。我们的队伍中有着许多来自不同学科背景、掌握着不同知识与技能的同学。在本次课题中, 我们致力于使用群体感应系统构建基础逻辑元件模块和与之配套的软硬件设备, 使得非生物学背景人员也能够利用我们提供的软硬件设施设计自己的生物回路。在生物工程学领域, 群体感应系统在同步群体行为, 设计复杂回路方面有着广泛的应用, 而表征群体感应系统的种种特性对于生物工程学领域的研究相当有价值。故此, 文中主要介绍了我们在去年的课题中所表征的不同的群体感应系统对相应的信号分子的响应曲线, 以及在表达群体感应外源蛋白的情况下宿主菌生长曲线的特征。如果想要了解我们项目在社会活动与硬件设计方面的工作, 欢迎访问我们的主页: http://2017.igem.org/Team:Shanghaitech。

|
| [1] |
Pirhonen M, Flego D, Heikinheimo R, et al. A small diffusible signal molecule is responsible for the global control of virulence and exoenzyme production in the plant pathogen Erwinia carotovora. EMBO J, 1993, 12(6): 2467-2476. DOI:10.1002/embj.1993.12.issue-6 |
| [2] |
Dickschat JS. Quorum sensing and bacterial biofilms. Nat Prod Rep, 2010, 27(3): 343-369. DOI:10.1039/b804469b |
| [3] |
O'Loughlin CT, Miller LC, Siryaporn A, et al. A quorum-sensing inhibitor blocks Pseudomonas aeruginosa virulence and biofilm formation. Proc Natl Acad Sci USA, 2013, 110(4): 17981-17986. |
| [4] |
Sauer K, Camper AK, Ehrlich GD, et al. Pseudomonas aeruginosa displays multiple phenotypes during development as a biofilm. J Bacteriol, 2002, 184(4): 1140-1154. DOI:10.1128/jb.184.4.1140-1154.2002 |
| [5] |
Ruby EG, Nealson KH. Symbiotic association of Photobacterium fischeri with the marine luminous fish Monocentris japonica: a model of symbiosis based on bacterial studies. Biol Bull, 1976, 151(3): 574-586. DOI:10.2307/1540507 |
| [6] |
Nealson KH, Platt T, Hastings JW. Cellular control of the synthesis and activity of the bacterial luminescent system. J Bacteriol, 1970, 104(1): 313-322. |
| [7] |
Hoch JA. Regulation of the phosphorelay and the initiation of sporulation in Bacillus subtilis. Annu Rev Microbiol, 1993, 47(1): 441-465. DOI:10.1146/annurev.mi.47.100193.002301 |
| [8] |
Pan JC, Ren DC. Quorum sensing inhibitors: a patent overview. Expert Opin Ther Pat, 2009, 19(11): 1581-1601. DOI:10.1517/13543770903222293 |
| [9] |
Eberl L. N-acyl homoserinelactone-mediated gene regulation in gram-negative bacteria. Syst Appl Microbiol, 1999, 22(4): 493-506. DOI:10.1016/S0723-2020(99)80001-0 |
| [10] |
McMillen D, Kopell N, Hasty J, et al. Synchronizing genetic relaxation oscillators by intercell signaling. Proc Natl Acad Sci USA, 2002, 99(2): 679-684. DOI:10.1073/pnas.022642299 |
| [11] |
Pai A, You LC. Optimal tuning of bacterial sensing potential. Mol Syst Biol, 2009, 5: 286. |
| [12] |
Elowitz MB, Leibler SA. A synthetic oscillatory network of transcriptional regulators. Nature, 2000, 403(6767): 335-338. DOI:10.1038/35002125 |
| [13] |
Stevenson K, McVey AF, Clark IBN, et al. General calibration of microbial growth in microplate readers. Sci Rep, 2016, 6: 38828. DOI:10.1038/srep38828 |
| [14] |
Ruparell A, Dubern JF, Ortori CA, et al. The fitness burden imposed by synthesising quorum sensing signals. Sci Rep, 2016, 6: 33101. DOI:10.1038/srep33101 |
| [15] |
Shong J, Collins CH. Engineering the esaR promoter for tunable quorum sensing-dependent gene expression. ACS Synth Biol, 2013, 2(10): 568-575. DOI:10.1021/sb4000433 |