
中国科学院微生物研究所、中国微生物学会主办
文章信息
- 刘洁, 许凯龙, 马立新, 王洋
- LIU Jie, XU Kailong, MA Lixin, WANG Yang
- 基于单细胞转录组的多级别胶质瘤异质性及免疫微环境分析揭示了潜在的预后生物标志物
- Single-cell transcriptome analysis of multigrade glioma heterogeneity and immune microenvironment revealed potential prognostic biomarkers
- 生物工程学报, 2022, 38(10): 3790-3808
- Chinese Journal of Biotechnology, 2022, 38(10): 3790-3808
- 10.13345/j.cjb.220481
-
文章历史
- Received: June 19, 2022
- Accepted: August 3, 2022
胶质瘤是大脑和脊髓中最常见的原发性肿瘤,至今仍然无法治愈。不同的遗传和非遗传效应决定了肿瘤生物学和临床过程。2007年,世界卫生组织(World Health Organization, WHO) 对中枢神经系统肿瘤进行了分类,将其划分为WHO Ⅰ到Ⅳ这4个级别[1],其中,异质性高,也是最恶性的一种脑胶质瘤是多形性胶质母细胞瘤,即胶质母细胞瘤(glioblastoma multiforme, GBM),即使积极地配合治疗,患者的中位生存期目前只有大约15个月。对于高级别的脑胶质瘤,标准的治疗方式是手术尽可能切除肿瘤,术后放疗和替莫唑胺(temozolomide, TMZ) 联合化疗的方案[2],而低级别胶质瘤则采用逐步向高级别胶质瘤过渡的模式。
近年来,随着单细胞测序技术的发展,更多的脑胶质瘤基因标志物被发现[3-4],新的靶点有望作为临床研究的热点。单细胞DNA和RNA分析的最新进展以单个细胞为研究对象[5],能够更好地保留肿瘤细胞间的异质性信息[6],为研究脑胶质瘤铺平了道路。除此之外,单细胞基因表达研究还使先前已知的细胞类型的特征得到更充分的定义,并促进了新型细胞类别的鉴定[7],有助于提高我们对正常和疾病相关生理过程的理解,并有益于发现新的治疗方法。
本文通过对单细胞转录组数据进行分析,重点研究不同分级的脑胶质瘤细胞间的异质性及其相关基因,希望为脑胶质瘤的精准治疗提供新的思路。
1 材料与方法 1.1 数据库使用的数据库包括NCBI (https://www.ncbi.nlm.nih.gov/)[8]、KEGG数据(https://www.kegg.jp/)[9]、GEPIA数据库(http://gepia.cancer-pku.cn/index.html)[10]、TIMER数据库(https://cistrome.shinyapps.io/timer/)[11]、PrognoScan数据库(http://dna00.bio.kyutech.ac.jp/PrognoScan/index.html)[12]、cBioPortal数据库(https://www.cbioportal.org/)[13]、LinkedOmics数据库(http://www.linkedomics.org/)[14]、CGGA数据库(http://www.cgga.org.cn/)[15]。
1.2 方法 1.2.1 单细胞转录组的获取GSE103224[16]、GSE138794[17]、GSE70630[18]数据集从GEO数据库(https://www.ncbi.nlm.nih.gov/geo/) 下载获得。
GSE103224数据集包括原发性胶质母细胞瘤(Ⅳ级)、复发性胶质母细胞瘤(Ⅳ级) 以及多形性成胶质细胞瘤(Ⅲ级)。GSE138794数据集包括弥漫性星形细胞瘤(Ⅱ级)、原发性星形细胞瘤(Ⅱ级) 和复发性少突胶质细胞瘤(Ⅱ级)。GSE70630数据集包括少突神经胶质瘤(Ⅱ级)。每个数据集纳入的样本个体信息整理为表 1。所有数据样本,共29 097个细胞。
| GEO No. | Sample | Diagnosis | Gender | Age |
| GSE103224 | GSM2758472 | Glioblastoma, WHO grade Ⅳ | Male | 62 |
| GSM2758473 | Glioblastoma, WHO grade Ⅳ | Male | 65 | |
| GSM2758474 | Glioblastoma, WHO grade Ⅳ | Male | 74 | |
| GSM2758475 | Anaplastic Astrocytoma, WHO grade Ⅲ | Female | 56 | |
| GSM2758476 | Glioblastoma, recurrent | Female | 63 | |
| GSM2758477 | Glioblastoma, recurrent | Male | 50 | |
| GSE138794 | GSM4119535 | Diffuse astrocytoma G2 | Male | 34 |
| GSM4119536 | Primary astrocytoma G2 | Male | 44 | |
| GSM4119539 | Recurrent oligodendroglioma | Male | 67 | |
| GSE70630 | GSM1812084 | Oligodendroglioma | NA | NA |
使用Seurat 4.1.3版本(表 2)[19],读取表达矩阵及细胞来源基本信息。设定过滤参数,滤去线粒体基因比例 > 50%的细胞以排除异常状态的细胞,并滤去测得基因数目 < 1 000或 > 4 000的细胞,以排除测序质量不佳及非单个细胞的数据。
| Software | Version |
| R | 4.1.1 |
| Seurat | 4.1.3 |
| ggplot2 | 3.3.2 |
| dplyr | 1.0.2 |
| tidyverse | 1.3.0 |
| devtools | 2.4.3 |
| patchwork | 1.1.1 |
根据原文献,确定不同细胞的标志(markers) 基因,并计算两组细胞之间至少0.25倍差异(对数尺度) 的差异高表达基因,以P < 0.05为显著差异的标准。
1.2.3 功能注释使用Seurat自带的FindMarkers函数找到LGG和GBM的差异基因,设置最小差异倍数为0.25。将得到的差异基因与GO、KEGG数据库比对,得到富集的代谢通路并作图。
1.2.4 差异基因的深度挖掘使用Seurat的FindAllMarkers函数得到的差异基因并进行排序,并以P-adjust < 0.01为标准筛选出每个细胞类型的显著差异的前10个高表达基因,得到70个基因,我们注意到,它们在不同级别的脑胶质瘤表达量是不同的,通过查阅文献,关注到delta样典型Notch配体3 (delta like canonical Notch ligand 3, DLL3) 这个基因。基于TCGA的基因表达谱交互分析(gene expression profiling interactive analysis, GEPIA) 数据库,探索LGG和GBM中DLL3基因的表达差异,采用基因表达谱交互式分析和肿瘤免疫学估计资源(tumor immune estimation resource, TIMER) 数据库,研究DLL3基因在脑胶质瘤中的表达。PrognoScan用于评估DLL3基因和脑胶质瘤预后之间的关系。LinkedOmics数据库分别分析DLL3共表达网络,并探索GO和KEGG途径。基于TCGA的GEPIA数据库用于探索LGG和GBM中DLL3基因的生存曲线,利用TIMER数据库研究了DLL3表达与LGG、GBM免疫浸润之间的关系。基因集富集分析(gene set enrichment analysis, GSEA) 进一步确定了与中心基因相关的途径。cBioPortal数据库用于探索DLL3基因与不同的免疫检查点的关系。最后,在中国胶质瘤基因组图谱(Chinese glioma genome atlas, CGGA) 中进行验证了。
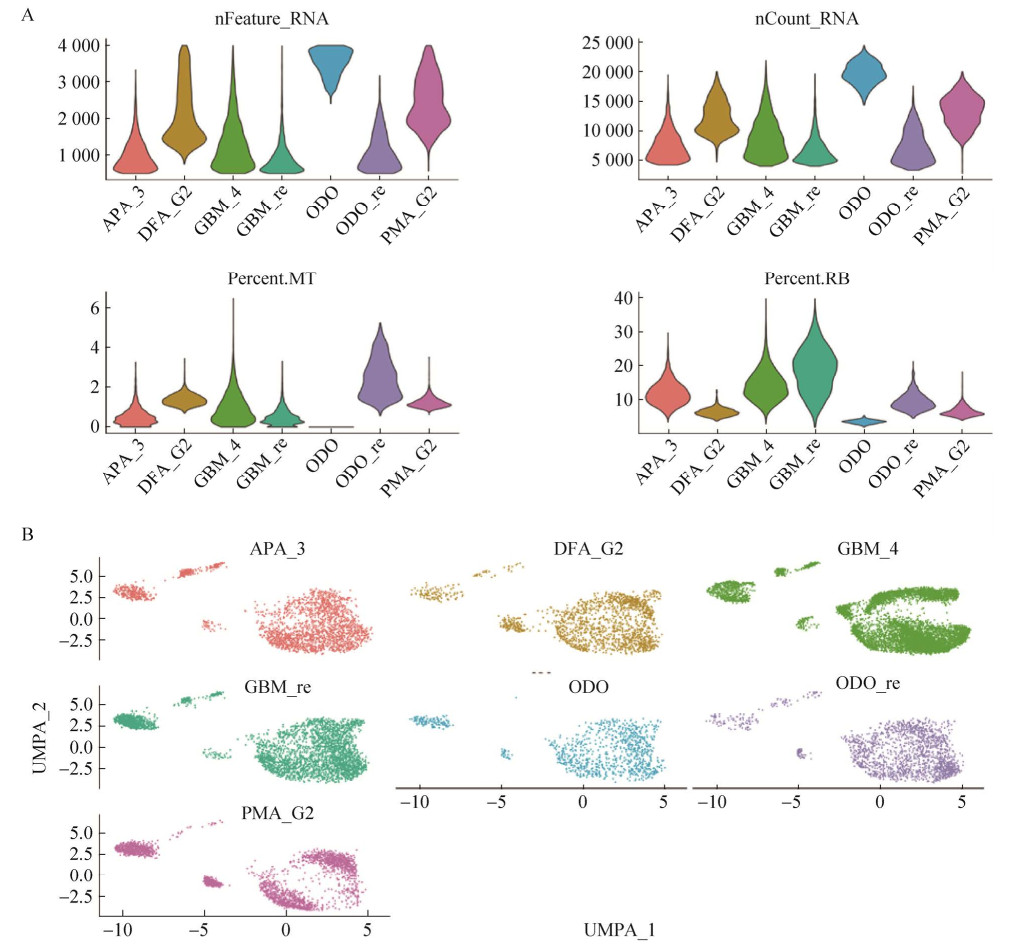
2 结果与分析 2.1 数据质量控制即使是高度敏感的单细胞转录组测序技术(single-cell RNA sequencing, scRNA-seq) 也会产生一小部分由于裂解或凋亡细胞而产生的低质量细胞,所以我们在进行分析前,需要进行质量控制,避免低质量细胞对于分析的影响。此处设置了3个标准:1) 线粒体基因比例(percent.MT) < 50%;2) 细胞核糖体基因比例(percent.RB) < 40%;3) 每个细胞检测到的基因数不低于500,不高于4 000。在经过过滤后,最终得到了符合标准的21 071个细胞(图 1A)。之后通过Harmony函数整合3个单细胞转录组数据集,去除批次效应的效果展示为图 1B。
|
| 图 1 细胞质量图 Fig. 1 Cell quality map. (A) Violin plot of cell mass after data filtering. (B) Effect of removing batch effects. |
| |
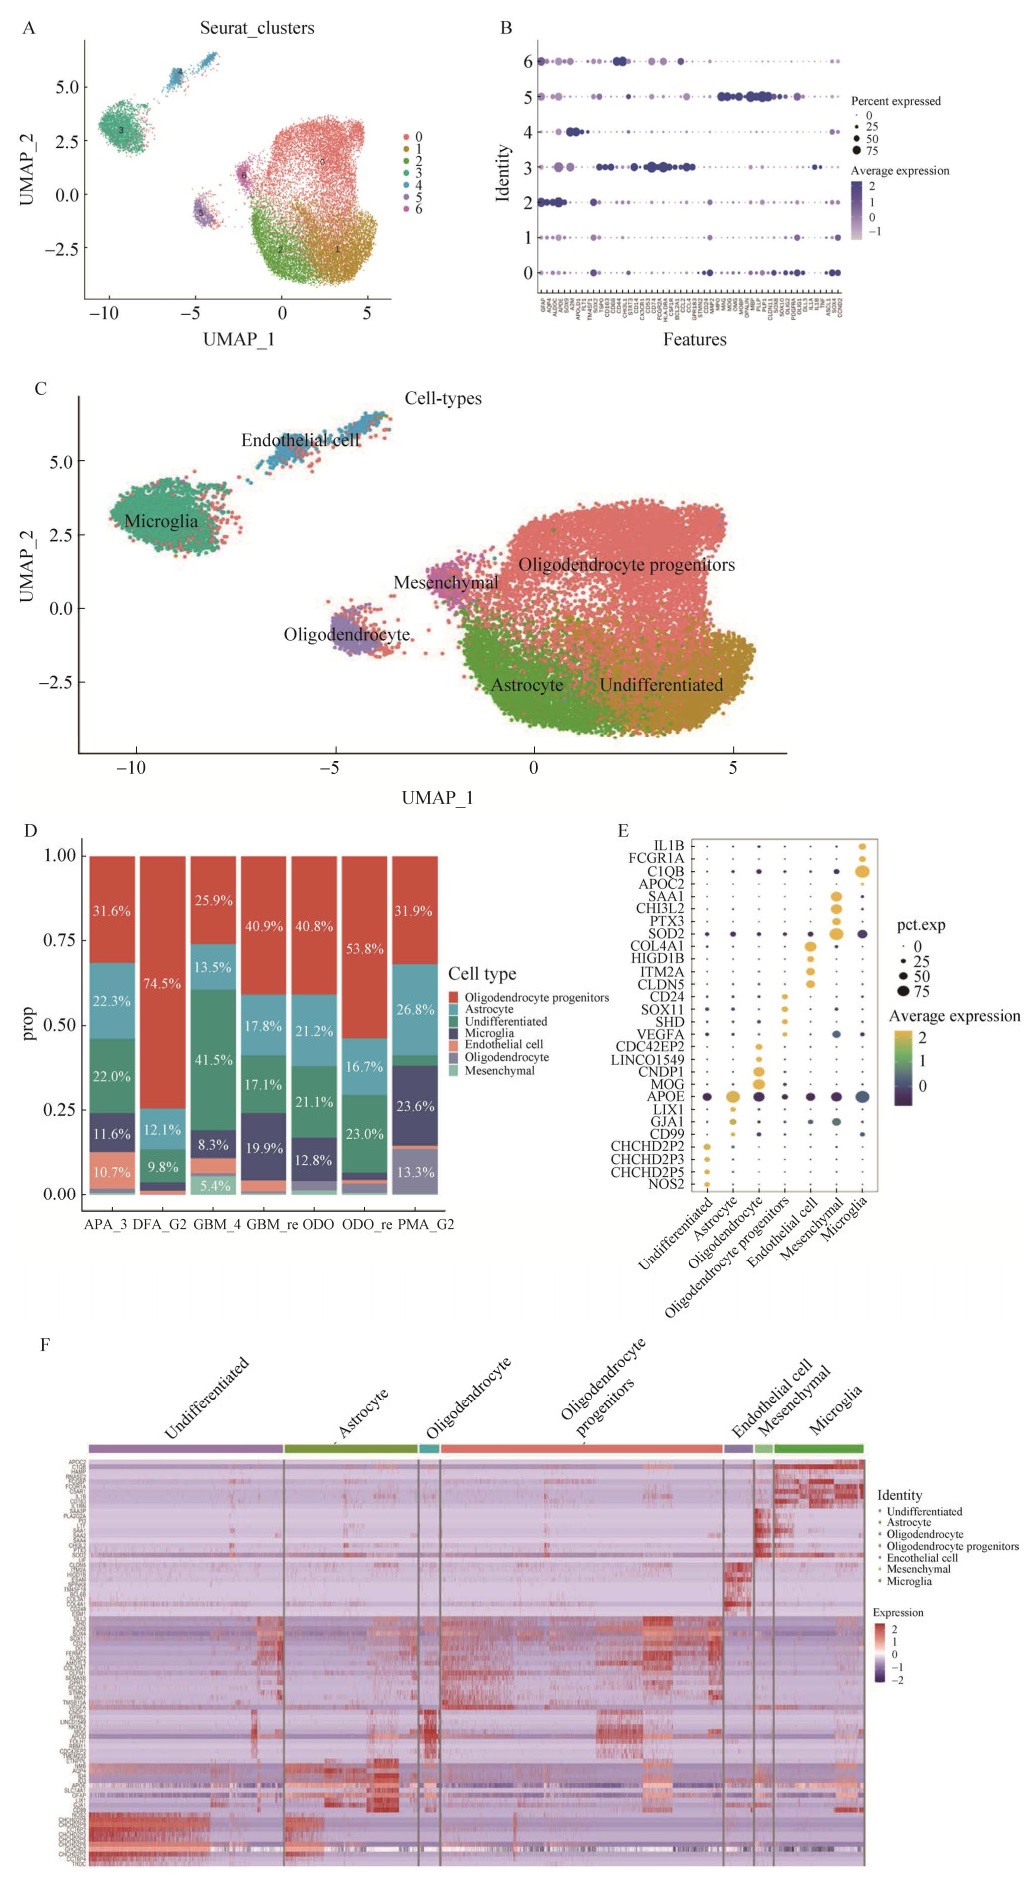
使用Seurat中的默认参数对其进行无监督聚类(图 2A),将Seurat、CellMarker、SingleR等数据库和原文文献中提到的已知标记一起用于细胞类型注释(图 2B),得到了对这些细胞最终的细胞类型注释结果。由图 2C可知,共识别了7个细胞类型,它们分别是:1) 少突胶质细胞祖细胞(oligodendrocyte progenitors);2) 少突细胞(oligodendrocyte);3) 星形胶质细胞(astrocyte);4) 内皮细胞(endothelial cell);5) 小神经胶质细胞(microglia);6) 间叶细胞(mesenchymal);7) 未分化的细胞(undifferentiated)。
|
| 图 2 对细胞进行注释得到不同的细胞类型 Fig. 2 Annotation of the cells yielded different cell types. (A) Unsupervised clustering of the data after QC, a total of 7 cellular taxa were obtained. (B) Markers of different cells were identified by reviewing the literature, and for the unsupervised clustering the taxa were divided into dot plots. (C) Different cell types were identified by annotating cells with the identified markers. (D) Different cell abundance plots were displayed. (E) Marker genes of different cell types were displayed. (F) Heat map of cellular marker genes. |
| |
从细胞丰度图(图 2D) 可以看出,不同级别胶质瘤中,不同细胞类型占比不同,在若干低级别的脑胶质瘤(弥漫性星形细胞瘤、复发性少突胶质细胞瘤和少突胶质细胞瘤) 中,少突胶质细胞祖细胞占比较大,而在高级别脑胶质瘤中的占比减小,这与现有研究结果[20-21]相符合,预示着细胞类型的变化在胶质瘤转化过程中起着重要的作用。
为了进一步验证对细胞的注释是否准确,将这7个细胞团的marker基因进行可视化,以点图的形式进行展示,结果见图 2E。从热图(图 2F) 中可以直接观察到marker基因的聚类效果非常明显。
2.3 相关差异基因功能分析为了进一步探究7个细胞亚群的异质性,我们使用FindMarkers函数,设置参数min.pct=0.5,将LGG分为一组,GBM为另一组,计算两组间的差异基因,根据P-adjust < 0.05和|log2FC| > 1标准筛选样本的差异表达基因(differentially expressed gene, DEG),得到基因589个,其中上调基因有365个,下调基因有224个。上调基因在LGG中上调。并针对这些基因,进行了GO、KEGG富集分析(图 3)。

|
| 图 3 GO和KEGG富集分析 Fig. 3 Enrichment analysis for GO and KEGG. (A) KEGG enrichment of up-regulated genes. (B) KEGG enrichment of down-regulated genes. (C) GO enrichment analysis. |
| |
结果表明,大部分的上调基因富集到冠状病毒COVID-19和核糖体这两条通路(图 3A),下调基因主要富集到多发性神经退行性疾病、老年痴呆症、帕金森病、泛素介导的蛋白质水解、脊髓小脑共济失调等(图 3B)。图 3C展示的是差异基因GO富集情况,从图中可以看出差异基因在生物过程(biological process, BP)、细胞组分(cellular component, CC) 和分子功能(molecular function, MF) 三大类上均有所富集,且在生物过程富集大多数集中在细胞质翻译、核糖体生物发生、RNA剪接和核糖核蛋白复合物组装等过程,在细胞组分这个功能分类上富集的差异基因主要在核糖体、剪接体和复合体等组分;差异基因在生物过程中主要富集到核糖体的结构成分、rRNA结合、钙粘蛋白结合、微管蛋白结合、蛋白质N端结合、核糖核蛋白复合物的结合、翻译起始因子活性、翻译调节活性和泛素样蛋白连接酶的结合。
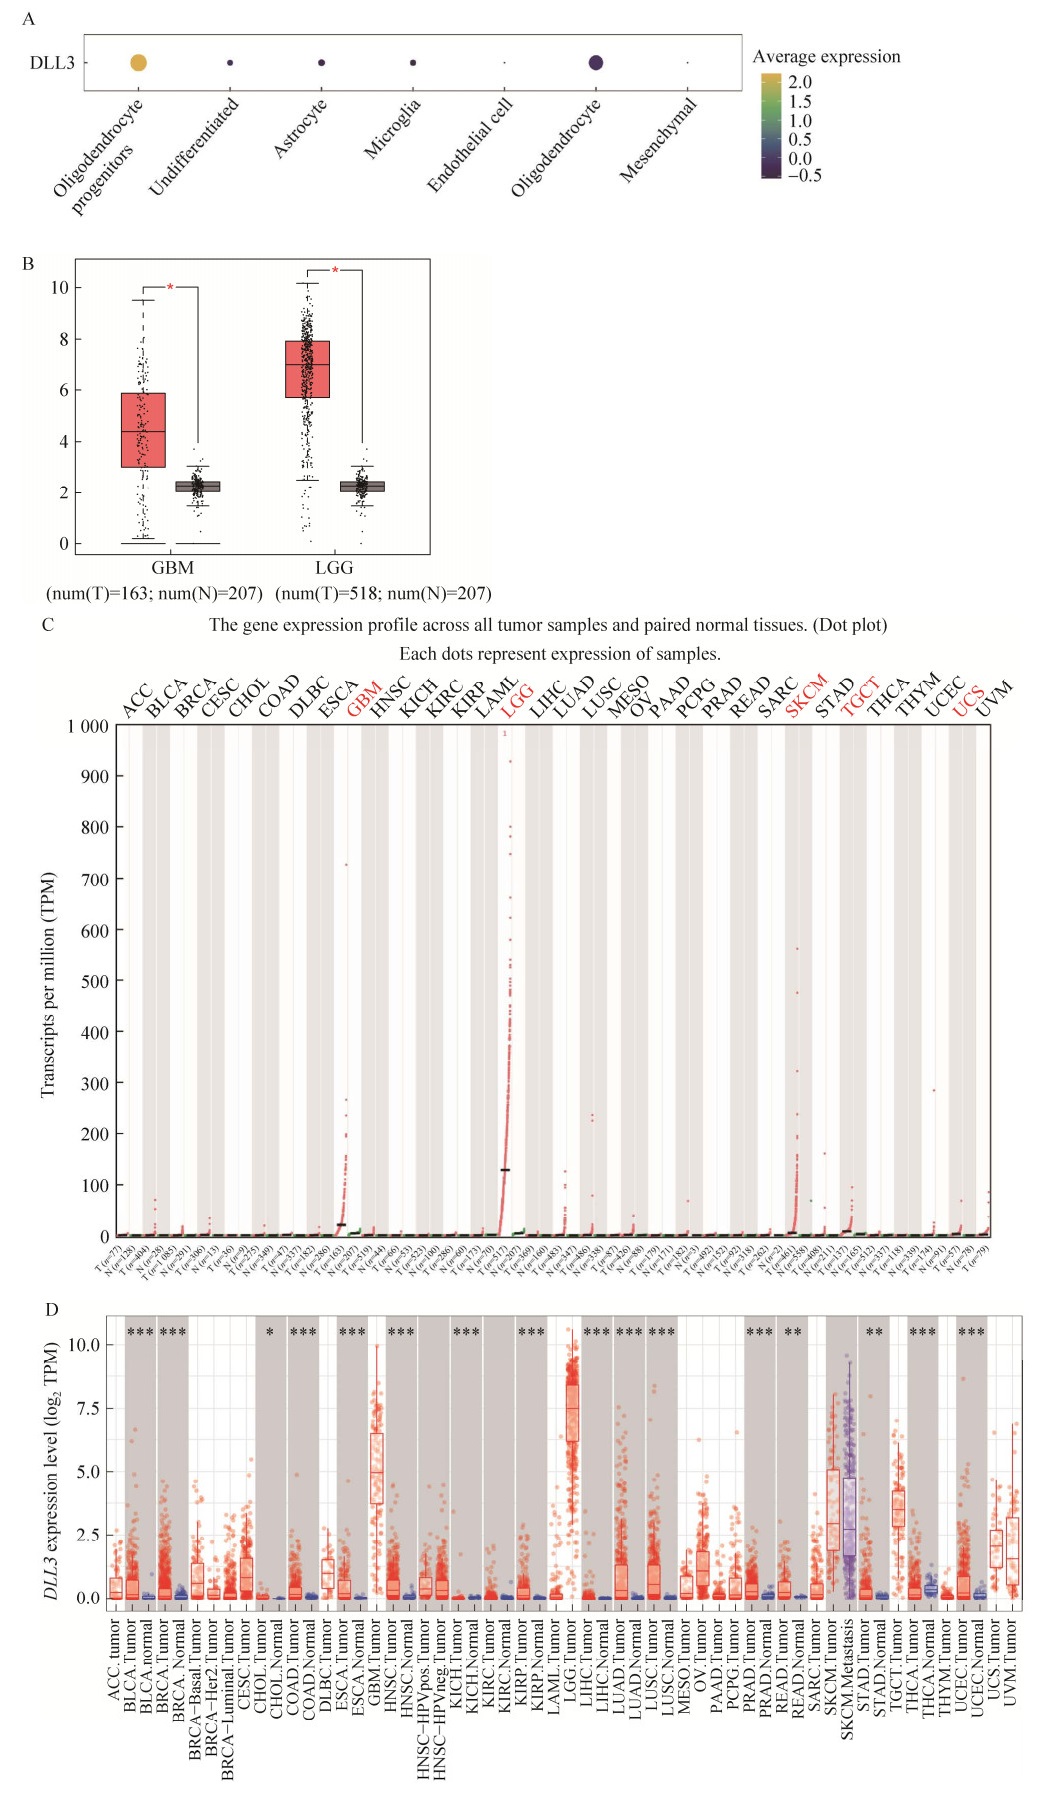
2.4 对于关键基因的免疫学分析我们使用FindAllMarkers函数得到的每个细胞亚群的过表达基因,通过对得到的差异基因进行排序,并以P-adjust < 0.01为更严格的标准,筛选出每个细胞类型差异表达前10的高表达基因。一共得到70个基因(表 3),我们注意到,它们在LGG和GBM表达量有明显的差别,比如DLL3这个基因(图 4A)。DLL3是一种高度肿瘤选择性的细胞表面靶点,主要表达于神经或者神经内分泌肿瘤,包括小细胞肺癌(small cell lung cancer, SCLC)、大细胞神经内分泌癌(large cell neuroendocrine carcinoma, LCNEC)、膀胱小细胞癌(small cell carcinoma, SCC)、多形性胶质细胞瘤等,有研究表明DLL3的表达和甲基化可能与低级别胶质瘤免疫微环境相关[22]。
| Gene | Avg_log2FC | pct.1 | pct.2 | p_val_adj | Custer | Description |
| DLL3 | 3.410 238 239 | 0.350 | 0.122 | 0 | Oligodendrocyte progenitors | Delta like canonical Notch ligand 3 |
| SHD | 2.845 875 744 | 0.309 | 0.082 | 0 | Oligodendrocyte progenitors | Src homology 2 domain containing transforming protein D |
| SOX8 | 2.615 222 345 | 0.458 | 0.153 | 0 | Oligodendrocyte progenitors | SRY-box transcription factor 8 |
| CHCHD2P8 | 3.426 176 487 | 0.536 | 0.064 | 0 | Undifferentiated | Coiled-coil-helix-coiled-coil-helix domain containing 2 pseudogene 8 |
| CCT6P2 | 3.294 988 474 | 0.460 | 0.057 | 0 | Undifferentiated | Chaperonin containing TCP1 subunit 6 pseudogene 2 |
| CCT6P4 | 3.062 597 090 | 0.188 | 0.013 | 0 | Undifferentiated | Chaperonin containing TCP1 subunit 6 pseudogene 4 |
| ETNPPL | 4.391 277 020 | 0.171 | 0.019 | 0 | Astrocyte | Ethanolamine-phosphate phospho-lyase |
| NMB | 3.940 812 892 | 0.508 | 0.213 | 0 | Astrocyte | Neuromedin B |
| AQP4 | 3.849 400 218 | 0.551 | 0.162 | 0 | Astrocyte | Aquaporin 4 |
| APOC2 | 8.906 366 847 | 0.130 | 0.002 | 0 | Microglia | Apolipoprotein C2 |
| C1QB | 7.813 605 993 | 0.922 | 0.109 | 0 | Microglia | Complement C1q B chain |
| HAMP | 7.541 877 947 | 0.152 | 0.004 | 0 | Microglia | Hepcidin antimicrobial peptide |
| CLDN5 | 8.522 981 467 | 0.529 | 0.042 | 0 | Endothelial cell | Claudin 5 |
| ITM2A | 8.290 803 182 | 0.521 | 0.021 | 0 | Endothelial cell | Integral membrane protein 2A |
| HIGD1B | 8.084 732 437 | 0.396 | 0.014 | 0 | Endothelial cell | HIG1 hypoxia inducible domain family member 1B |
| CNDP1 | 5.140 824 549 | 0.686 | 0.046 | 0 | Oligodendrocyte | Carnosine dipeptidase 1 |
| GPR62 | 4.937 039 264 | 0.382 | 0.016 | 0 | Oligodendrocyte | G protein-coupled receptor 62 |
| LINC01549 | 4.570 673 933 | 0.325 | 0.024 | 0 | Oligodendrocyte | Long intergenic non-protein coding RNA 1 549 |
|
| 图 4 DLL3基因在不同级别脑胶质瘤中的表达差异 Fig. 4 Differential expression of DLL3 gene in different grades of glioma. (A) Expression of DLL3 gene in different cell types. (B) Differential expression of DLL3 gene in GBM and LGG in the GEPIA database in focus. (C) DLL3 expression in the GEPIA database. (D) DLL3 expression in the TIMER database. For Figure 4B, 4D, statistical significance was tested using Wilcoxon test. ***: P < 0.001; **: P < 0.01; *: P < 0.05. |
| |
为了探究DLL3基因是否具有预后标志物的价值,我们首先评估DLL3基因在LGG和GBM中表达的差异,使用GEPIA和TIMER数据库分析了DLL3 mRNA水平。与GEPIA中的正常组织相比,DLL3在LGG的癌组织中明显高表达,而在GBM的癌组织中高表达但没有LGG中表达量高(图 4B–C)。在TIMER中,同样观察到DLL3在LGG、GBM中高表达,在LGG中表达情况比GBM明显(图 4D)。
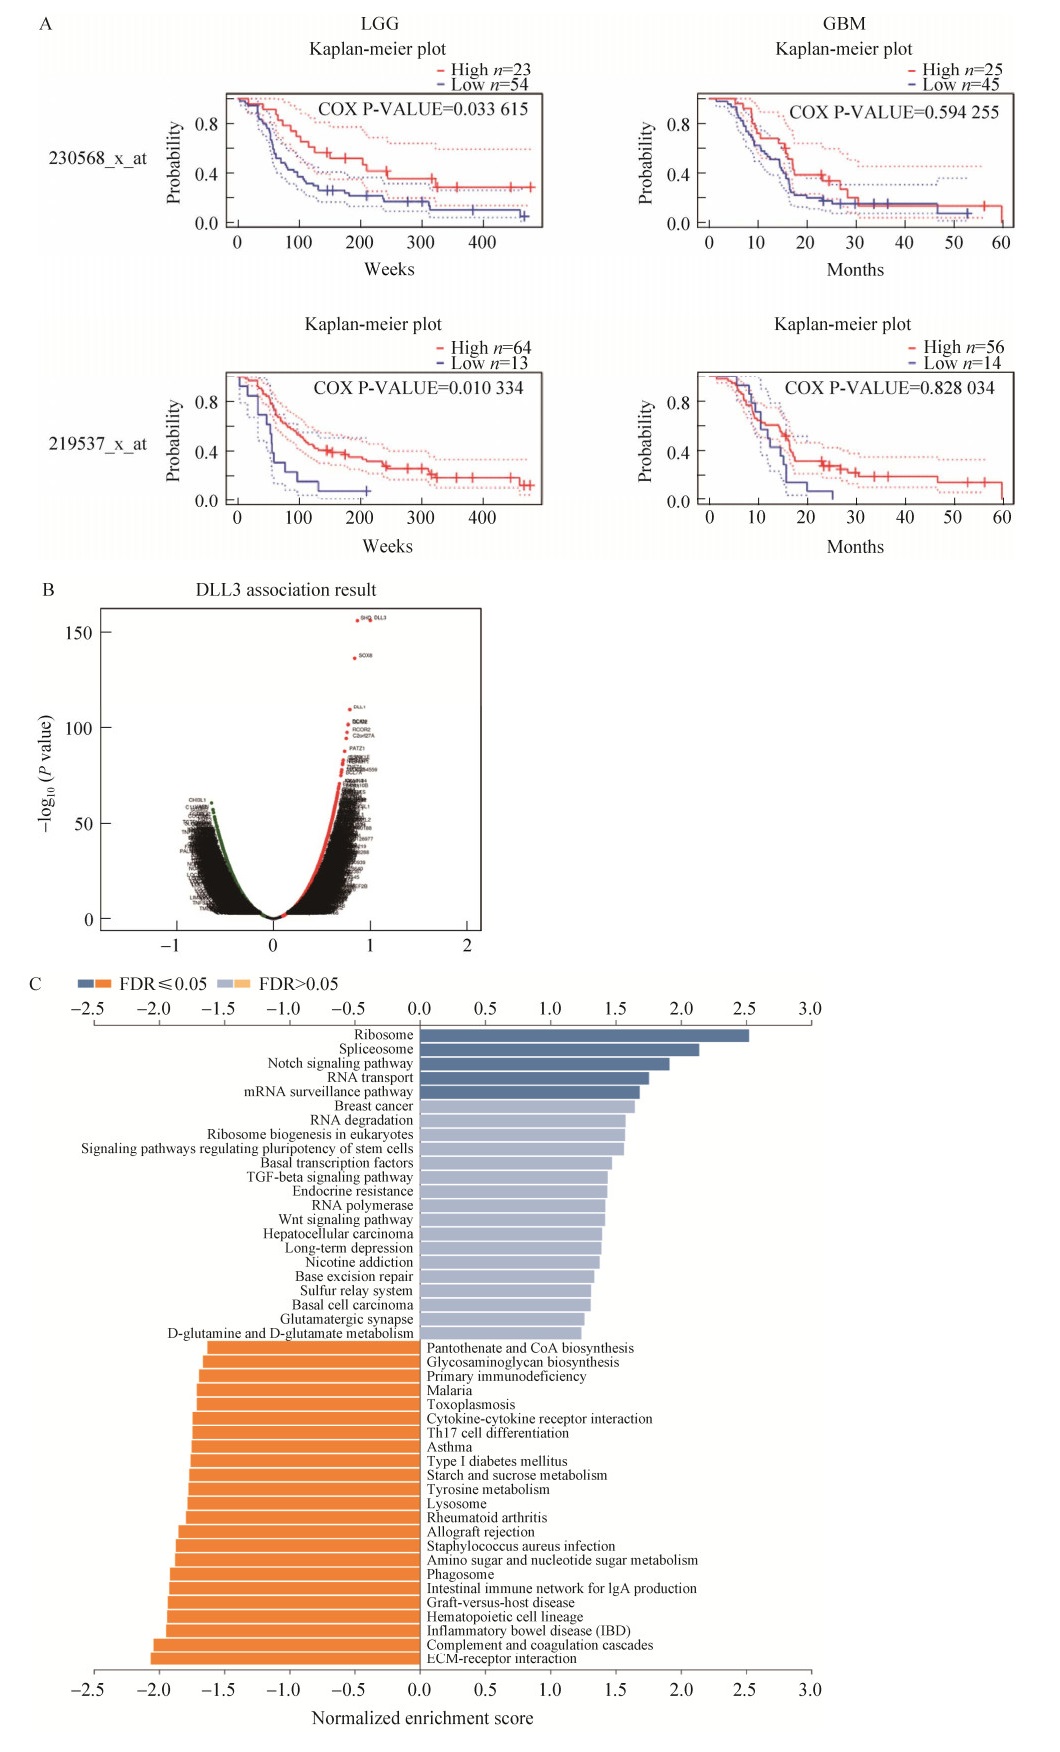
使用PrognoScan评估DLL3基因预后情况。DLL3表达与LGG患者的预后显著相关,但是在GBM中并不显著相关,高表达LGG的患者存活率高(图 5A)。为了了解DLL3基因在脑胶质瘤中的生物学功能,使用LinkedOmics门户中的LinkFinder模块来检查DLL3基因在TCGA-GBM中的共表达模式。如图 5B所示,与DLL3基因正相关的基因为深红点,与DLL3基因负相关的基因为深绿色点。GSEA分析发现(图 5C),DLL3基因的共表达基因主要富集在核糖体和剪接体中,可以发现核糖体可能在其中起到重要作用。
|
| 图 5 DLL3基因的差异表达对不同脑胶质瘤的生物学意义 Fig. 5 The biological significance of the differential expression of DLL3 gene in different brain gliomas. (A) Different prognosis of two groups of samples with different expression of DLL3 gene in PrognoScan in LGG and GBM. (B) Co-expressed genes of DLL3 in LinkFinder. (C) GESA enrichment of DLL3 co-expressed genes. |
| |
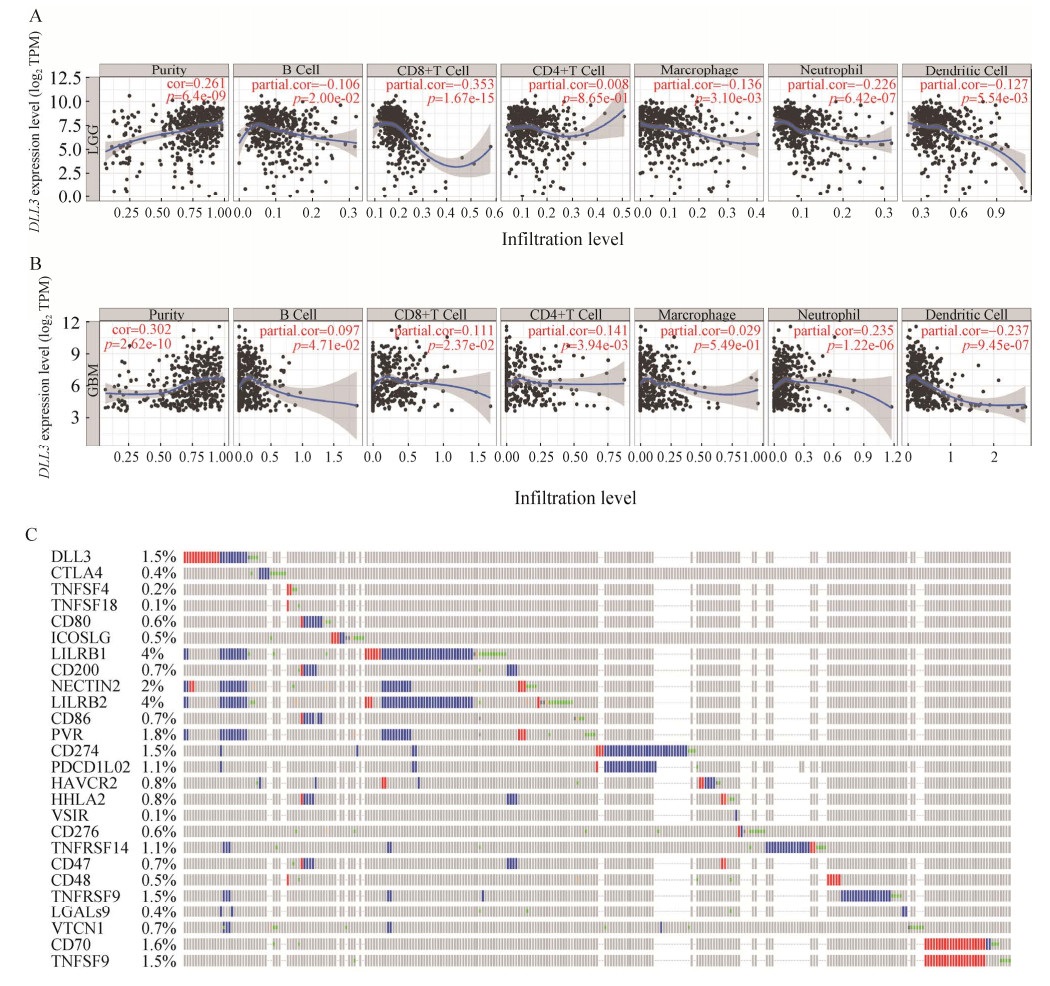
肿瘤内免疫浸润的存在可以产生重要的生物标志物来预测肿瘤患者的预后,对放疗、化疗和治疗有影响。因此,研究DLL3基因和免疫细胞之间的关系至关重要。我们使用TIMER中的“基因”模块进行数据库搜索,输入靶基因DLL3,然后选择LGG和GBM。浸润分析结果显示(图 6A–B),DLL3基因的表达在LGG中与几乎所有的免疫细胞呈负相关,比如与CD8+ T细胞(cor=−0.353,p=1.67e-15),在GBM中与CD8+ T细胞(cor=0.111,p=0.023 7)、中性粒细胞(cor=0.235,p=1.22e-06) 呈正相关,和树突状细胞(cor=−0.237,p=9.45e-07) 呈负相关。
|
| 图 6 DLL3基因的免疫浸润分析和免疫检查点的相关性分析 Fig. 6 Immunoinfiltration analysis of DLL3 gene and correlation analysis of immune checkpoints. (A) Immune infiltration of DLL3 gene in LGG cells in the TIMER database. (B) Immune infiltration of DLL3 gene in GBM cells in the TIMER database. (C) Correlation of DLL3 gene and 25 immune checkpoint alterations in cBioPortal. |
| |
在本文中,cBioPortal用于可视化和比较DLL3基因与免疫检查点之间的相关性。分析的免疫检查点包括CTLA4、TNFSF4、TNFSF18、CD80、ICOSLG、LILRB1、CD200、NECTIN2、LILRB2、CD86、PVR、CD274、PDCD1LG2、HAVCR2、HHLA2、VSIR、CD276、TNFRSF14、CD47、CD48、TNFRSF9、LGALS9、VTCN1、CD70、TNFSF9,一共25个。选择了包括3 122个样本在内的4个数据集(MSK,TCGA,MSKCC,GLASS),检查DLL3基因与每个免疫检查点之间的关联,结果表明(表 4),DLL3基因参与了LGG免疫检查点的改变,DLL3基因的改变显示出与免疫检查点NECTIN2、PVR、LILRB2、LILRB1、TNFRSF14、VTCN1、TNFRSF9、CTLA4、LGALS9之间强烈的共调控关系,这些发现强烈表明DLL3基因是LGG免疫检查点的潜在共同调节因子。
| A | B | Neither | A not B | B not A | Both | Log2 odds ratio | P-value | Q-value | Tendency |
| DLL3 | NECTIN2 | 1 480 | 12 | 16 | 13 | > 3 | < 0.001 | < 0.001 | Co-occurrence |
| DLL3 | PVR | 1 480 | 14 | 16 | 11 | > 3 | < 0.001 | < 0.001 | Co-occurrence |
| DLL3 | LILRB2 | 1 456 | 12 | 40 | 13 | > 3 | < 0.001 | < 0.001 | Co-occurrence |
| DLL3 | LILRB1 | 1 455 | 13 | 41 | 12 | > 3 | < 0.001 | < 0.001 | Co-occurrence |
| DLL3 | TNFRSF14 | 1 488 | 22 | 8 | 3 | > 3 | < 0.001 | 0.005 | Co-occurrence |
| DLL3 | VTCN1 | 1 488 | 22 | 8 | 3 | > 3 | < 0.001 | 0.005 | Co-occurrence |
| DLL3 | TNFRSF9 | 1 480 | 22 | 16 | 3 | > 3 | 0.003 | 0.025 | Co-occurrence |
| DLL3 | CTLA4 | 1 492 | 23 | 4 | 2 | > 3 | 0.004 | 0.027 | Co-occurrence |
| DLL3 | LGALS9 | 1 492 | 23 | 4 | 2 | > 3 | 0.004 | 0.027 | Co-occurrence |
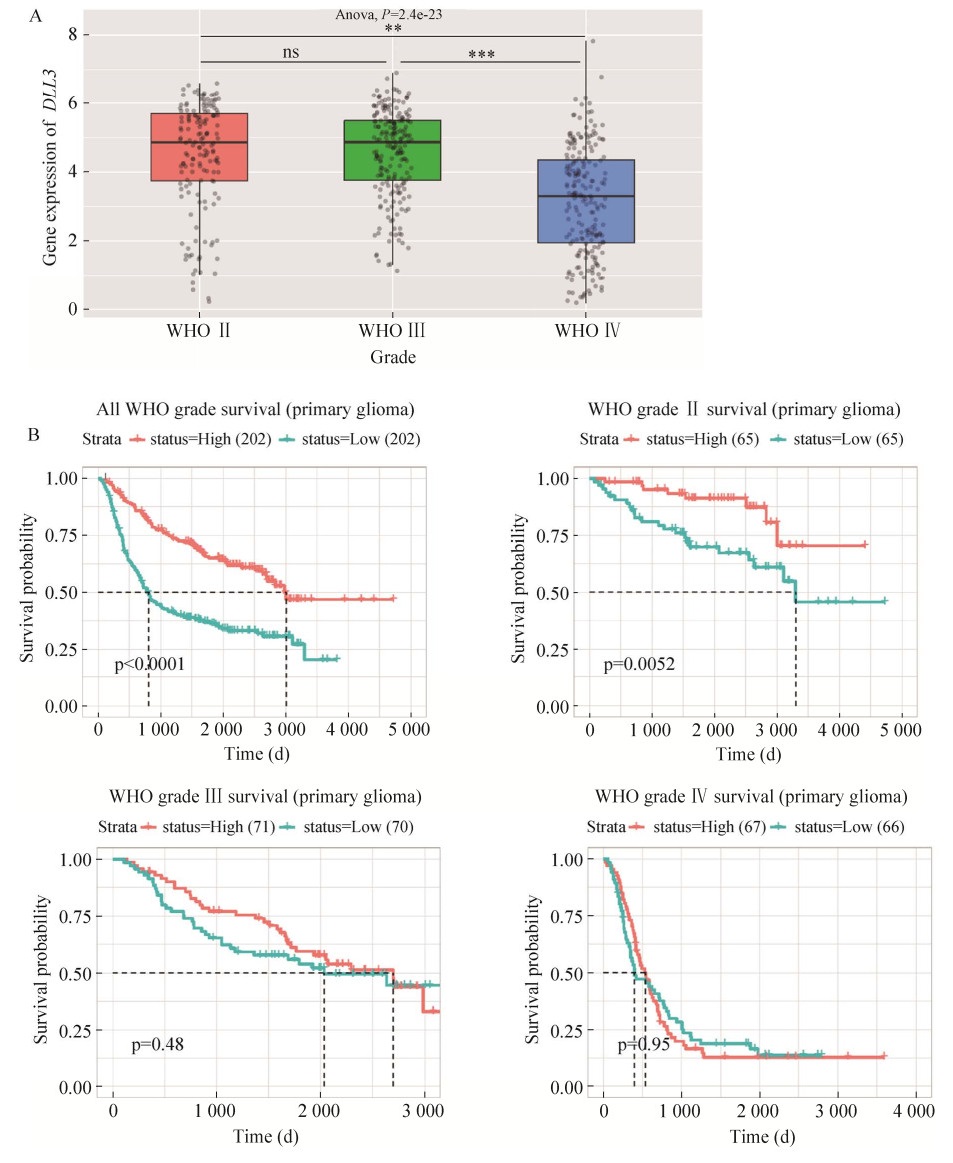
最后,以上结果在中国胶质瘤基因组图谱(CGGA) 中进行了验证。DLL3基因在低级别脑胶质瘤中确实高表达,且高于在高级别脑胶质瘤中的表达(图 7A),且高表达DLL3基因的低级别脑胶质瘤患者明显存活率增高(图 7B)。在高级别脑胶质瘤患者中,DLL3基因可能失去了它的保护性作用。
|
| 图 7 在CGGA中验证DLL3基因的表达差异以及预后情况 Fig. 7 Differences in DLL3 expression as well as the verified prognosis in CGGA. (A) Differential expression of DLL3 in different grades of glioma cells in CGGA database. Statistical significance was tested using two-sided Studentʼs t test. **P < 0.01; *** P < 0.001. (B) Differential prognosis of DLL3 in CGGA database. |
| |
单细胞转录组测序技术(single-cell RNA-seq, scRNA-seq) 能够快速测定数以万计的单个细胞的精确基因表达模式[23]。传统的转录组测序技术(bulk RNA-seq) 是基于群体细胞,每个样本包含成千上万个细胞,所以最终反映的是基因在群体细胞中的平均表达水平,从而掩盖了不同细胞之间的表达异质性。而单细胞转录组测序技术可在单细胞水平揭示全基因组范围内所有基因的表达情况,非常有利于研究细胞间的表达异质性。
本文利用单细胞转录组测序技术,对于公共数据库中的脑胶质瘤数据进行了处理并分析,深度挖掘了DLL3基因在LGG和GBM的不同表达情况及免疫浸润和预后的不同。
这项研究中,在LGG和GBM之间鉴定出589个差异表达基因,上调基因在核糖体通路中显著丰富,富集到若干编码核糖体蛋白的基因,比如RPL3,最近的一项脑胶质瘤相关的研究显示,RPL3在核糖体途径中富集,核糖体途径是一种最显著的上调途径[24]。癌细胞的增强生长需要蛋白质合成的增加,这与核糖体活性的增加相关。更有研究证明,外在核糖体掺入体细胞中可产生干细胞特性,并成为细胞重编程过程的关键触发因素[25]。我们的研究揭示了核糖体缺陷与胶质瘤进展存在更密切的联系。下调基因多数富集到神经退行性疾病的若干通路中,大多数神经系统疾病是由异常的基因翻译引起的[26],而胶质瘤的生长是由最终调节蛋白质合成的信号驱动的[27],所以我们认为脑胶质瘤的包括RNA修饰在内的过程中存在更为复杂的分子机制。
有研究显示,DLL3甲基化与LGG中的DLL3 mRNA表达表现出不同程度的相关性[22, 28]。DLL3是Notch途径的关键成员之一[29],在发育过程中,Notch信号传导促进神经胶质细胞的形成并抑制其分化。先前在少突胶质瘤[30]、肝细胞癌[29]、小细胞肺癌[31-32]中的发现显示DLL3 mRNA在这些癌症中的表观遗传调控。有报道称与DLL3 mRNA表达负相关的DLL3 CpG位点的甲基化影响了LGG的预后[22]。我们的研究确定了DLL3在LGG中有显著预后价值。研究结果证明,DLL3在各种恶性肿瘤中的表达与在正常组织中的表达不同,且DLL3在LGG中高度表达。随后,在数据库中考察了DLL3的表达与LGG、GBM患者预后的关系,很明显DLL3高表达的LGG患者的预后较好。通常来讲,对于常规的组织器官而言,当然是免疫细胞浸润程度越高、抗肿瘤、靶向杀伤的效果越好。但是大脑具有血脑屏障,低级别的脑胶质瘤预后较好,血脑屏障功能健全,免疫细胞很难进入到大脑内部;只有高级别脑胶质瘤才有可能破坏血脑屏障,有机会浸润更多免疫细胞,这就造成了免疫细胞浸润的高级别脑胶质瘤反而预后坏的现象。基于此,我们在本研究发现DLL3在LGG中的表达水平高于GBM,同时,DLL3的表达水平与免疫细胞浸润程度在两种不同级别的胶质瘤中呈现相反的趋势。DLL3可能为LGG进展到GBM过程中起到保护性作用,证明DLL3可能是LGG进展为GBM的关键基因之一。此外,由于大脑结构的特殊性,DLL3基因的这种“特别的情况”并不是唯一的发现。事实上,也有研究指出,在LGG中,SYT16的表达水平与B细胞、CD4+ T细胞、巨噬细胞、中性粒细胞和树突细胞的浸润水平呈显著负相关,且上调SYT16表达是良好预后的独立预后因素[33]。最近的一项研究针对TCGA数据库中32种不同类型的癌症中免疫细胞浸润水平与生存预后的关系进行了报道,指出浸润增加仅与LGG、GBM和葡萄膜黑色素瘤的预后恶化显著相关[34]。确定LGG和GBM之间的分子差异可能被证明有助于在未来开发新的靶向治疗方法。
在验证了DLL3在脑胶质瘤中的差异表达和预后潜力后,为了更好地服务于临床,我们接下来探讨了DLL3潜在的免疫治疗方案,我们知道脑胶质瘤标准的治疗方式是手术切除加上术后放疗联合化疗的方案[2],但是效果往往不尽如人意。因此,有必要探索一种新的联合治疗方法。肿瘤免疫疗法被认为是一种新的和潜在的肿瘤治疗方法[35]。肿瘤相关免疫细胞在体内的浸润状态共同构成了肿瘤细胞的免疫微环境[36],这些免疫细胞可能具有肿瘤拮抗或肿瘤促进作用。结果表明,DLL3的表达水平与B细胞和CD8+ T细胞呈负相关,与CD4+ T细胞和巨噬细胞呈正相关。这表明DLL3在脑胶质瘤的免疫浸润中起着特殊的作用,免疫微环境在抗癌免疫中起到关键作用。
免疫治疗中另一种最受欢迎的方法是免疫检查点阻断[37]。PD-1/PD-L1和CTLA-4被认为是目前最主要的免疫检查点[38]。近十年来,免疫检查点相关研究领域取得了长足的进步。免疫检查点阻滞(immune checkpoint blockade, ICB) 在这种类型的癌症中非常成功。越来越多的证据表明,靶向致癌的小分子抑制剂所起的作用远远超出了肿瘤的生物学行为,例如:针对PD-1、PD-L1和CTLA-4的单克隆抗体(monoclonal antibody) 通过激活细胞毒性T淋巴细胞来增强抗肿瘤反应[39-40]。胶质母细胞瘤和种系、双等位基因DNA修复缺陷的患者对纳武单抗有较好的应答[41-42],支持我们的设想。我们研究发现,有9个免疫检查点对DLL3基因有共调控,可以预想其小分子抑制剂和免疫检查点抑制剂的组合可能使患者受益。
本文采用生物信息学方法分析了DLL3基因在脑胶质瘤中的表达和预后,但是,不可避免地,我们的测试有一定的局限性。首先,我们验证实验中入组的患者数量相对较少,因此将在后期更新患者数量。其次,本研究只提出可能的致病途径,需要进一步的实验验证,最后,需要对小分子抑制剂进行动物实验和长期临床试验,然后将其应用于患者。因此,未来对DLL3与癌症发展和进展关系的研究可能会导致具有重大预后甚至治疗价值的发现。
| [1] |
Chen R, Smith-Cohn M, Cohen AL, et al. Glioma subclassifications and their clinical significance. Neurotherapeutics, 2017, 14(2): 284-297. DOI:10.1007/s13311-017-0519-x
|
| [2] |
Anjum K, Shagufta BI, Abbas SQ, et al. Current status and future therapeutic perspectives of glioblastoma multiforme (GBM) therapy: a review. Biomed Pharmacother, 2017, 92: 681-689. DOI:10.1016/j.biopha.2017.05.125
|
| [3] |
Śledzińska P, Bebyn MG, Furtak J, et al. Prognostic and predictive biomarkers in gliomas. Int J Mol Sci, 2021, 22(19): 10373. DOI:10.3390/ijms221910373
|
| [4] |
Ludwig K, Kornblum HI. Molecular markers in glioma. J Neuro Oncol, 2017, 134(3): 505-512. DOI:10.1007/s11060-017-2379-y
|
| [5] |
Tirosh I, Suvà ML. Dissecting human gliomas by single-cell RNA sequencing. Neuro Oncol, 2017, 20(1): 37-43.
|
| [6] |
Patel AP, Tirosh I, Trombetta JJ, et al. Single-cell RNA-seq highlights intratumoral heterogeneity in primary glioblastoma. Science, 2014, 344(6190): 1396-1401. DOI:10.1126/science.1254257
|
| [7] |
Bonaguidi MA. Evaluation of Weng et al. : Leveraging cell type correlations and single-cell bioinformatics to identify progenitor diversity and lineage.. Cell Stem Cell, 2019, 24(5): 671-672. DOI:10.1016/j.stem.2019.04.011
|
| [8] |
Consortium GO. The gene ontology resource: enriching a gold mine. Nucleic Acids Res, 2021, 49(D1): D325-D334. DOI:10.1093/nar/gkaa1113
|
| [9] |
Ogata H, Goto S, Sato K, et al. KEGG: kyoto encyclopedia of genes and genomes. Nucleic Acids Res, 1999, 27(1): 29-34. DOI:10.1093/nar/27.1.29
|
| [10] |
Tang ZF, Li CW, Kang BX, et al. GEPIA: a web server for cancer and normal gene expression profiling and interactive analyses. Nucleic Acids Res, 2017, 45(W1): W98-W102. DOI:10.1093/nar/gkx247
|
| [11] |
Li TW, Fu JX, Zeng ZX, et al. TIMER2.0 for analysis of tumor-infiltrating immune cells. Nucleic Acids Res, 2020, 48(W1): W509-W514. DOI:10.1093/nar/gkaa407
|
| [12] |
Mizuno H, Kitada K, Nakai KT, et al. PrognoScan: a new database for meta-analysis of the prognostic value of genes. BMC Med Genomics, 2009, 2: 18. DOI:10.1186/1755-8794-2-18
|
| [13] |
Gao JJ, Aksoy BA, Dogrusoz U, et al. Integrative analysis of complex cancer genomics and clinical profiles using the cBioPortal. Sci Signal, 2013, 6(269): pl1.
|
| [14] |
Vasaikar SV, Straub P, Wang J, et al. LinkedOmics: analyzing multi-omics data within and across 32 cancer types. Nucleic Acids Res, 2017, 46(D1): D956-D963.
|
| [15] |
Zhao Z, Zhang KN, Wang QW, et al. Chinese glioma genome atlas (CGGA): a comprehensive resource with functional genomic data from Chinese glioma patients. Genomics Proteomics Bioinformatics, 2021, 19(1): 1-12. DOI:10.1016/j.gpb.2020.10.005
|
| [16] |
Tirosh I, Venteicher AS, Hebert C, et al. Single-cell RNA-seq supports a developmental hierarchy in human oligodendroglioma. Nature, 2016, 539(7628): 309-313. DOI:10.1038/nature20123
|
| [17] |
Yuan JZ, Levitin HM, Frattini V, et al. Single-cell transcriptome analysis of lineage diversity in high-grade glioma. Genome Med, 2018, 10(1): 57. DOI:10.1186/s13073-018-0567-9
|
| [18] |
Wang L, Babikir H, Müller S, et al. The phenotypes of proliferating glioblastoma cells reside on a single axis of variation. Cancer Discov, 2019, 9(12): 1708-1719. DOI:10.1158/2159-8290.CD-19-0329
|
| [19] |
Hao YH, Hao S, Andersen-Nissen E, et al. Integrated analysis of multimodal single-cell data. Cell, 2021, 184(13): 3573-3587.e29. DOI:10.1016/j.cell.2021.04.048
|
| [20] |
Ilkhanizadeh S, Lau J, Huang M, et al. Glial progenitors as targets for transformation in glioma. Adv Cancer Res, 2014, 121: 1-65.
|
| [21] |
Filbin MG, Tirosh I, Hovestadt V, et al. Developmental and oncogenic programs in H3K27M gliomas dissected by single-cell RNA-seq. Science, 2018, 360(6386): 331-335. DOI:10.1126/science.aao4750
|
| [22] |
Noor H, Whittaker S, McDonald KL. DLL3 expression and methylation are associated with lower-grade glioma immune microenvironment and prognosis. Genomics, 2022, 114(2): 110289. DOI:10.1016/j.ygeno.2022.110289
|
| [23] |
Kolodziejczyk AA, Kim JK, Svensson V, et al. The technology and biology of single-cell RNA sequencing. Mol Cell, 2015, 58(4): 610-620. DOI:10.1016/j.molcel.2015.04.005
|
| [24] |
Wei B, Wang R, Wang L, et al. Prognostic factor identification by analysis of the gene expression and DNA methylation data in glioma. Math Biosci Eng, 2020, 17(4): 3909-3924. DOI:10.3934/mbe.2020217
|
| [25] |
Shirakawa Y, Ohta K, Miyake S, et al. Glioma cells acquire stem-like characters by extrinsic ribosome stimuli. Cells, 2021, 10(11): 2970. DOI:10.3390/cells10112970
|
| [26] |
Zhang SX, Chen YR, Wang YJ, et al. Insights into translatomics in the nervous system. Front Genet, 2020, 11: 599548. DOI:10.3389/fgene.2020.599548
|
| [27] |
Gonzalez C, Sims JS, Hornstein N, et al. Ribosome profiling reveals a cell-type-specific translational landscape in brain tumors. J Neurosci, 2014, 34(33): 10924-10936. DOI:10.1523/JNEUROSCI.0084-14.2014
|
| [28] |
Maimaiti A, Wang XX, Hao YJ, et al. Integrated gene expression and methylation analyses identify DLL3 as a biomarker for prognosis of malignant glioma. J Mol Neurosci, 2021, 71(8): 1622-1635. DOI:10.1007/s12031-021-01817-7
|
| [29] |
Mizuno Y, Maemura K, Tanaka Y, et al. Expression of delta-like 3 is downregulated by aberrant DNA methylation and histone modification in hepatocellular carcinoma. Oncol Rep, 2018, 39(5): 2209-2216.
|
| [30] |
Mur P, Mollejo M, Ruano Y, et al. Codeletion of 1p and 19q determines distinct gene methylation and expression profiles in IDH-mutated oligodendroglial tumors. Acta Neuropathol, 2013, 126(2): 277-289. DOI:10.1007/s00401-013-1130-9
|
| [31] |
Hipp S, Voynov V, Drobits-Handl B, et al. A bispecific DLL3/CD3 IgG-like T-cell engaging antibody induces antitumor responses in small cell lung cancer. Clin Cancer Res, 2020, 26(19): 5258-5268. DOI:10.1158/1078-0432.CCR-20-0926
|
| [32] |
Chen X, Amar N, Zhu YK, et al. Combined DLL3-targeted bispecific antibody with PD-1 inhibition is efficient to suppress small cell lung cancer growth. J Immunother Cancer, 2020, 8(1): e000785. DOI:10.1136/jitc-2020-000785
|
| [33] |
Chen JF, Wang ZH, Wang W, et al. SYT16 is a prognostic biomarker and correlated with immune infiltrates in glioma: a study based on TCGA data. Int Immunopharmacol, 2020, 84: 106490. DOI:10.1016/j.intimp.2020.106490
|
| [34] |
Zuo SG, Wei M, Wang SQ, et al. Pan-cancer analysis of immune cell infiltration identifies a prognostic immune-cell characteristic score (ICCS) in lung adenocarcinoma. Front Immunol, 2020, 11: 1218. DOI:10.3389/fimmu.2020.01218
|
| [35] |
Jain KK. Personalized immuno-oncology. Med Princ Pract, 2021, 30(1): 1-16. DOI:10.1159/000511107
|
| [36] |
Ma QQ, Long WY, Xing CS, et al. Cancer stem cells and immunosuppressive microenvironment in glioma. Front Immunol, 2018, 9: 2924. DOI:10.3389/fimmu.2018.02924
|
| [37] |
Huang X, Tang TY, Zhang G, et al. Genomic investigation of co-targeting tumor immune microenvironment and immune checkpoints in pan-cancer immunotherapy. NPJ Precis Oncol, 2020, 4(1): 29. DOI:10.1038/s41698-020-00136-1
|
| [38] |
Havel JJ, Chowell D, Chan TA. The evolving landscape of biomarkers for checkpoint inhibitor immunotherapy. Nat Rev Cancer, 2019, 19(3): 133-150. DOI:10.1038/s41568-019-0116-x
|
| [39] |
Zhang QF, Li J, Jiang K, et al. CDK4/6 inhibition promotes immune infiltration in ovarian cancer and synergizes with PD-1 blockade in a B cell-dependent manner. Theranostics, 2020, 10(23): 10619-10633. DOI:10.7150/thno.44871
|
| [40] |
Zhang JY, Zhang Y, Qu BX, et al. If small molecules immunotherapy comes, can the prime be far behind. Eur J Med Chem, 2021, 218: 113356. DOI:10.1016/j.ejmech.2021.113356
|
| [41] |
Wang HX, Xu T, Huang QL, et al. Immunotherapy for malignant glioma: current status and future directions. Trends Pharmacol Sci, 2020, 41(2): 123-138. DOI:10.1016/j.tips.2019.12.003
|
| [42] |
Filley AC, Henriquez M, Dey M. Recurrent glioma clinical trial, CheckMate-143: the game is not over yet. Oncotarget, 2017, 8(53): 91779-91794. DOI:10.18632/oncotarget.21586
|
 2022, Vol. 38


